The revenue equation should be simple (list price x volume) – rebates = net revenue. However, in the world of life sciences and medical technology manufacturing, revenue management is rarely this straightforward. Price pressures abound and with provider consolidation and intense competition on the rise, medtech manufacturers are facing challenges from all sides.
While negotiating and executing favorable contracts around the world is a critical goal for organizations who want to meet their revenue goals, it’s a big goal that most organizations need to break down into parts to achieve. There are multiple steps and intermediaries who take part in the journey of a product from the manufacturer to the patient and much more is involved in the revenue transaction process than a simple rebate.
Manufacturers must work effectively across intermediary channels to maximize revenue. These intermediary stakeholders include group purchasing organizations (GPOs), distributors, pharmacy benefits managers (PBMs), insurance companies, hospitals, clinics, and the government. Managing these relationships and achieving visibility throughout the contracting and pricing process is essential for medtech manufacturers to keep revenue flowing. On the flip side, a poorly configured contract and hard-to-enforce pricing can lead to millions in lost revenue, lower market share, and risk of fines and penalties for regulatory noncompliance.
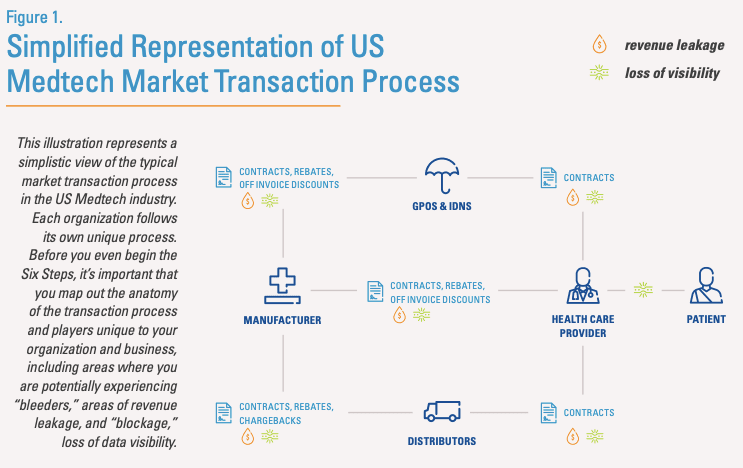
In order to optimize pricing and contracting opportunities, we must first understand how the revenue system works in the medtech manufacturing industry. As shown below in figure 1, the revenue transaction process requires all parties, whether in sales, the front office of the back office, to work together while identifying areas of revenue leakage and loss of visibility. Each business unit has its function and when everything is working together, the system has a healthy flow of revenue.

As we all know, issues often come up, and when they do, the flow of revenue is interrupted and kept from operating at its best. There are two ways that revenue leakage can occur:
- Bleeders: Also known as transaction points, this is when revenue leakage occurs through overpayments in the form of chargebacks, discounts, rebates, and other deductions. Pricing complexities also impact revenue leakage. One device may have different prices for different regions, different channels, and even end markets. Inconsistent pricing execution and unwarranted overpayments contribute to the overall complexity of the revenue management process. As a result, it is not uncommon for medtech companies to find revenue leakage in the millions of dollars due to the ever-growing chasm between list and net price.
- Blockages: These are points where the flow of data is interrupted or loss of visibility occurs throughout the revenue management process and results in revenue leakage. Siloed operations and/or reliance on partners and intermediaries to share accurate data quickly can become “blockers” if the data being shared is inaccurate, arrives late or isn’t available for use within the workflow. These “blockers” can obstruct the flow of information and hamper visibility into the transaction, which ultimately have an impact on top line revenue growth and the net revenue results of the business. This lack of transparency spills over into other areas including unreliable reporting and analytics, poor forecasting capabilities making it difficult to make key business decisions, and lengthy sales cycles resulting in lost revenue.
Revenue management practices are critical in order to engage all relevant parties in the process and keep them working together to achieve the optimal flow of data and reach maximize revenue. By avoiding the key sources of revenue leakage, medtech manufacturers can improve profitability and ensure they remain competitive in this high pressure environment.
To download the full Six Step Guide to Revenue Execution, click here or email info@modeln.com for assistance.


